ProductsHow It WorksThe StudioThe Orchestrator
EnterpriseOverviewIntelligenceWho It's ForSecurityIT Governance
Pricing
ResourcesNewsAboutFAQ
Get in touch
Intelligence
Everything else exists to generate this.
Security protects the data. Governance structures the decisions. The tooling captures every interaction. Intelligence is what happens when all of that compounds into a strategic asset the organisation owns.
The blind spot
Each vendor sees only their own slice. Nobody sees the whole picture.
The Anthropic console shows Claude usage. OpenAI shows GPT usage. Google shows Gemini. Three dashboards, three partial views, zero cross-vendor intelligence.
Total spend across all of them? Which model works best for which task? Whether AI is actually making people more productive? No single vendor can answer these questions.
Swarmix sits at the coordination layer. It captures interaction data across every vendor, every model, and every team. One unified view of how the entire organisation uses AI.
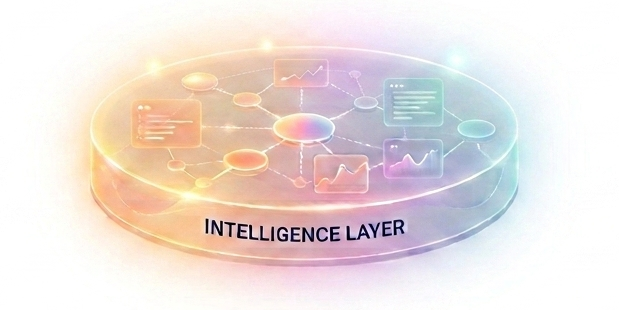
Three layers, one intelligence stream
Every layer of Swarmix feeds the intelligence engine
The Studio captures interactions. The Hive captures security and compliance events. The Orchestrator captures decisions and knowledge. Combined, they produce intelligence no single vendor can match.
Combined, these three layers produce intelligence no single vendor can match.
Six pillars of business value
From raw usage data to board-level intelligence
Each pillar answers a question the board asks, with a metric they can track quarterly.
Cost intelligence
Is the AI spend creating measurable value, or just growing invoices? Task-level economics by team, department, and region. Cost-per-outcome, not token counting. Reveals wasted spend and drives budget allocation.
- Department-level chargeback with cost-per-task granularity
- Automated model routing: simple tasks to efficient models
- ROI quantification against actual time saved, not estimates
Adoption and engagement
Paying for 500 seats and getting value from 80? Sessions per user, feature depth, activity heatmaps, and resumption rates across every team. Shows who is productive, who is struggling, and who has not started.
- Identify low-adoption teams before contract renewal
- Right-size contracts by reallocating unused seats
- Target enablement with evidence, not assumptions
Risk and governance
Could the AI usage survive a regulatory audit today? PII exposure by category, department, and region. Approval friction analysis. Automated evidence generation for SOC 2, ISO 27001, and ISO 42001.
- Audit-ready compliance packs generated from live data
- Region-specific policy tuning based on actual exposure patterns
- Department-level AI risk dashboards for the CISO
Workforce effectiveness
Is AI making people more effective, or just more dependent? Interaction friction, prompt quality, turns-to-resolution, and session outcomes. Measures whether AI is building capability, not just speed.
- Training ROI: this workshop reduced friction 40% in two weeks
- AI fluency benchmarking across teams and seniority levels
- Measurable time-to-proficiency curves for new hires
Strategic control
One vendor decision away from a crisis? Model performance by task type, vendor concentration analysis, and workflow dependency mapping. Data-driven diversification instead of single-provider lock-in.
- Vendor concentration scoring with threshold alerts
- Model recommendation policies grounded in task-fit data
- Multi-vendor strategy backed by comparative performance evidence
Operational resilience
What breaks if the primary AI provider goes down tomorrow? Dependency mapping across critical workflows, anomaly detection on usage patterns, and capacity trend analysis. Resilience that scales with adoption.
- Dependency impact maps for every critical workflow
- Anomaly alerts for sudden PII spikes or approval bypass
- Capacity forecasting from observed growth trends
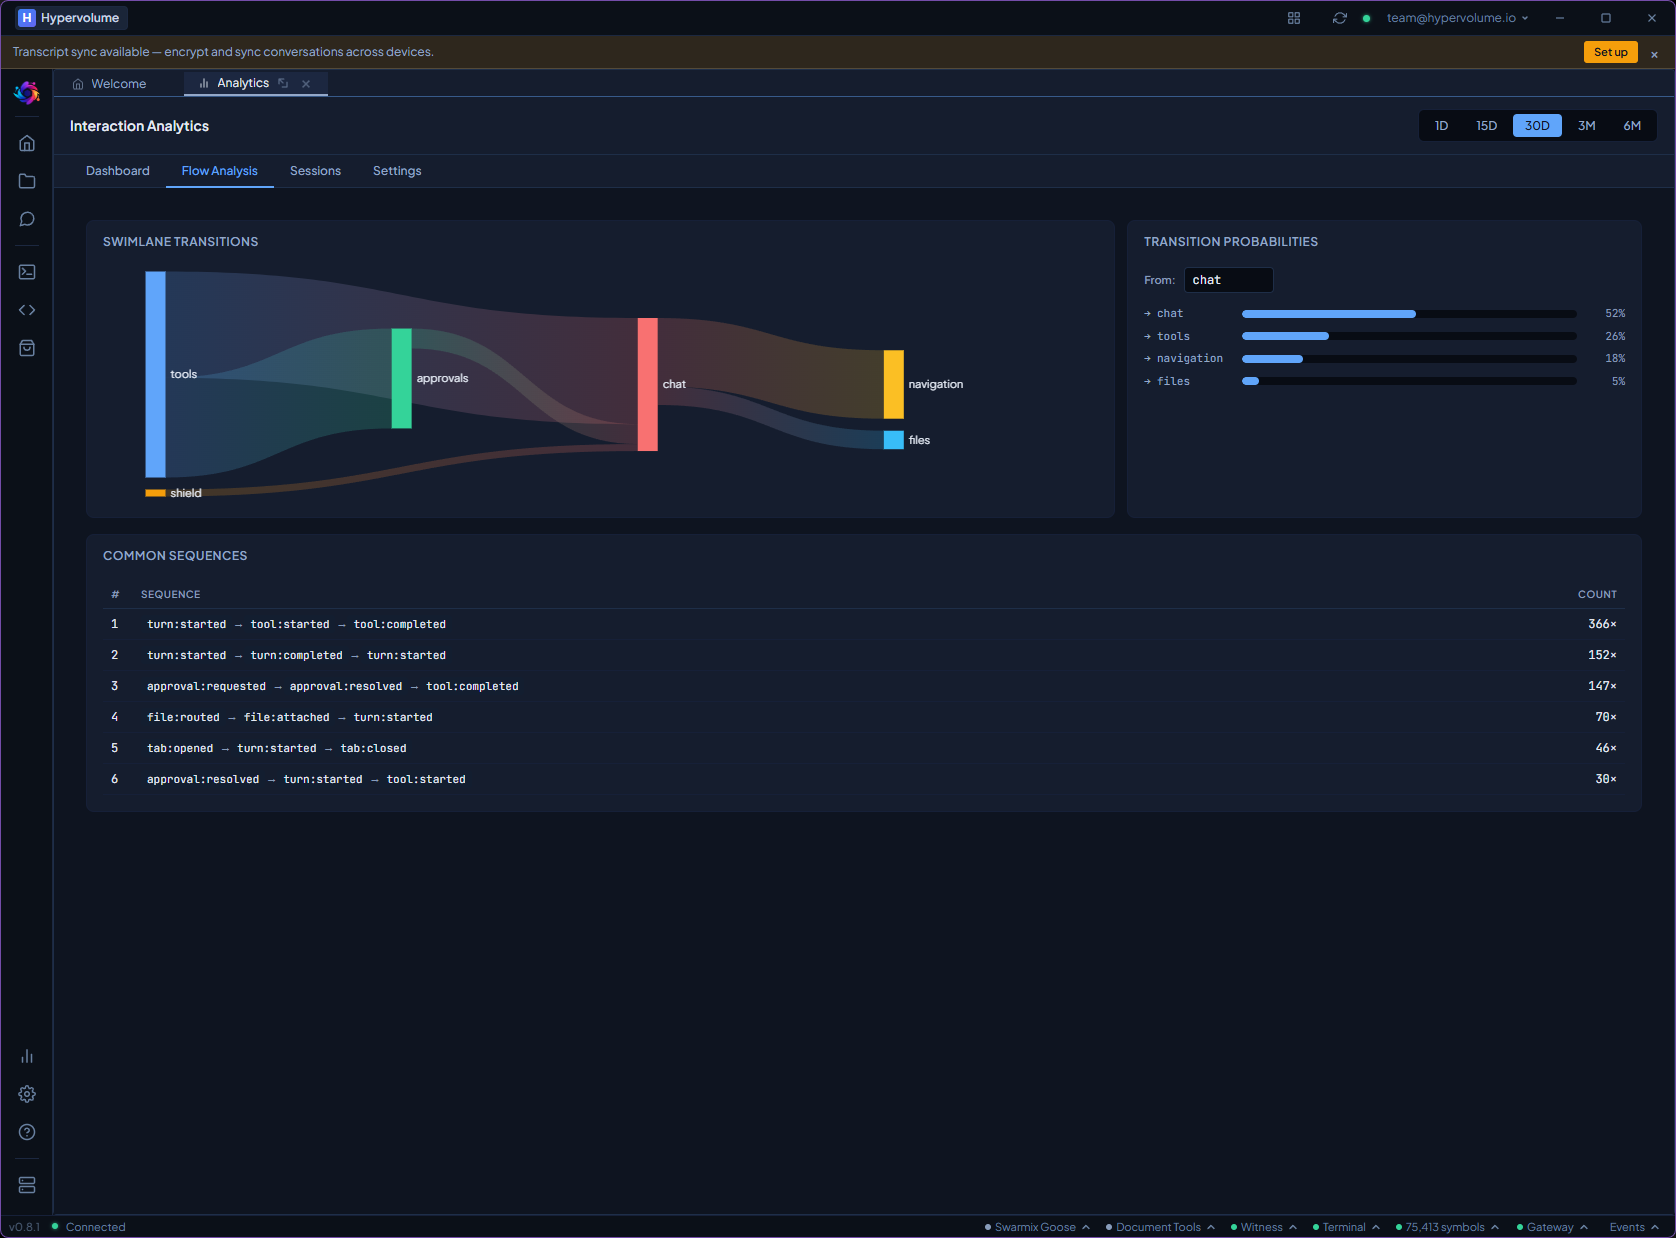
Preview
A glimpse of what is coming
Early designs. The final product may look different, but the intelligence it delivers will not.
Planned for Q4 2026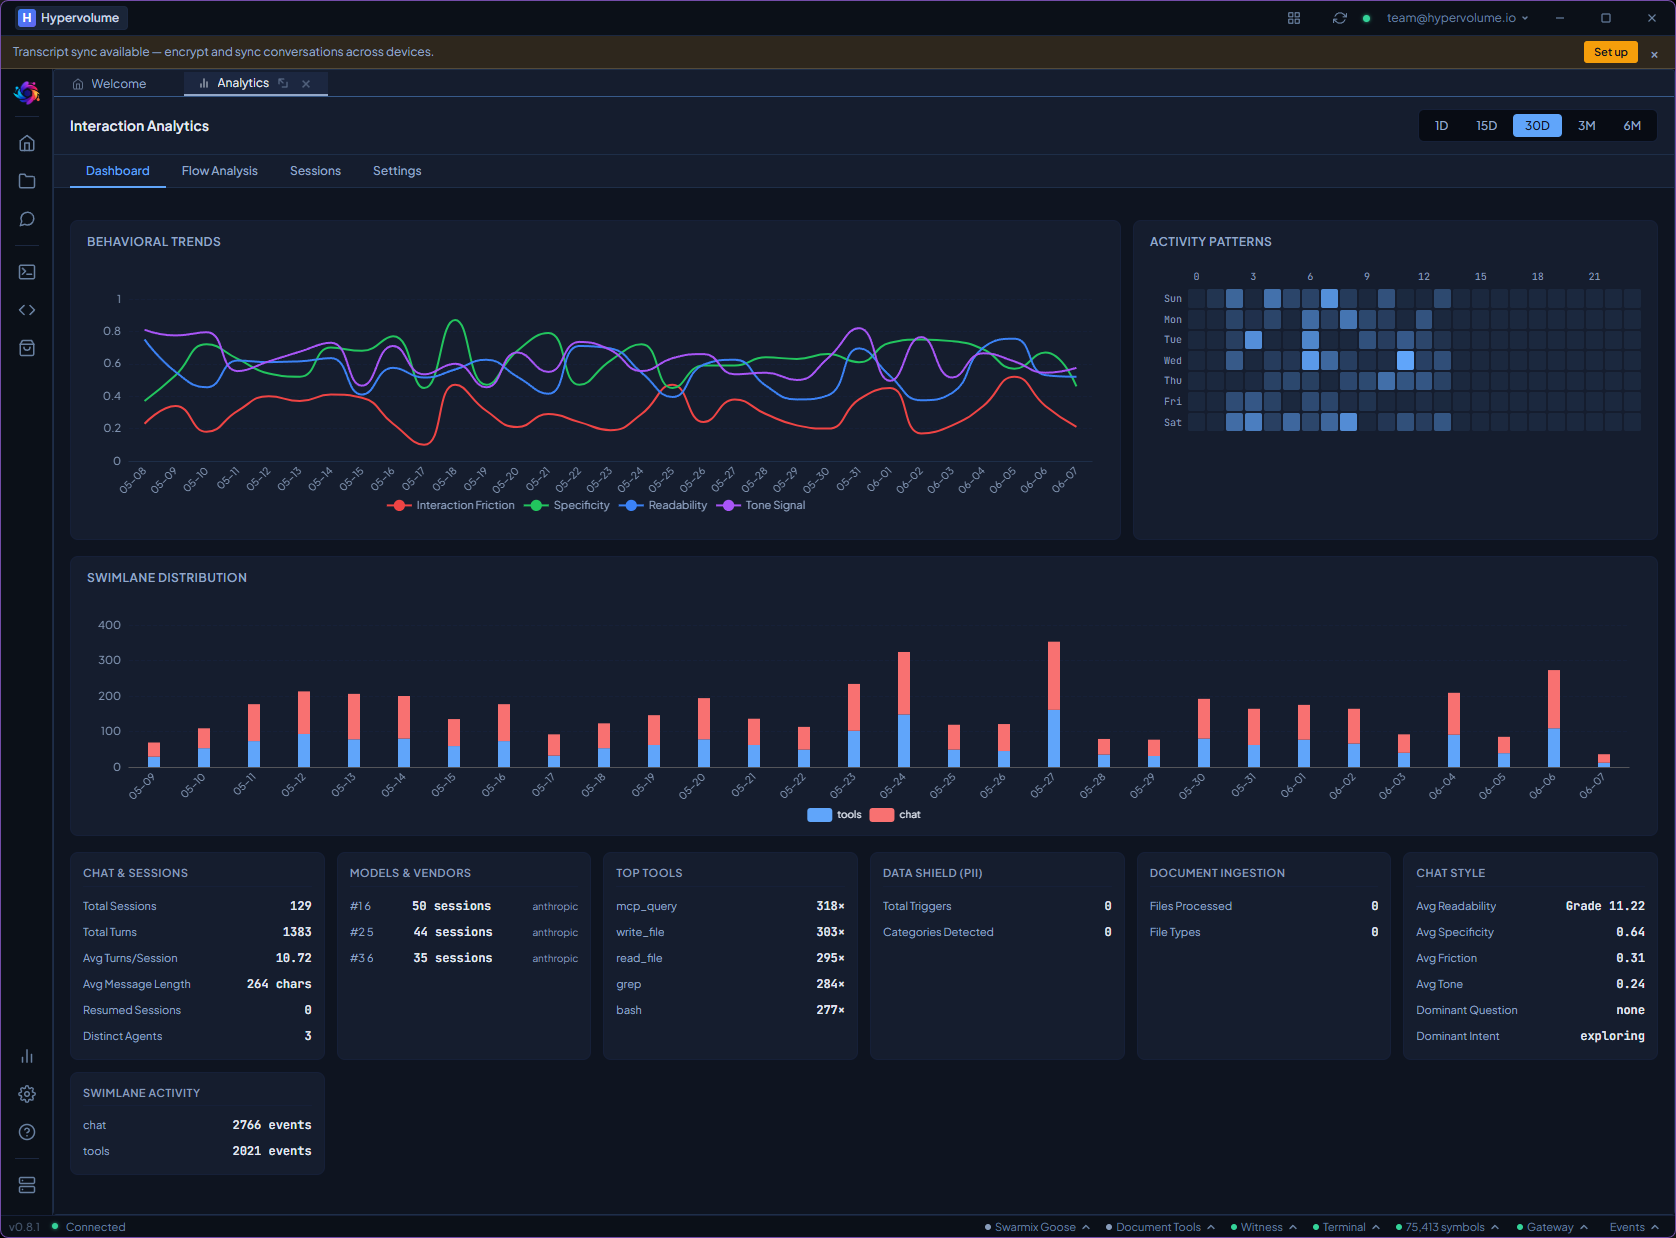
Privacy-first aggregation
From individual privacy to company-wide intelligence
Data flows upward from private (individual) to strategic (company), with privacy enforcement at every level.
Content never leaves the device.
Only structural metrics aggregate.
Aggregated metrics require at least 5 users per group - no individual can be singled out. Content never leaves the device; only structural metrics roll up.
How it is different
Vendors keep the intelligence. Swarmix returns it.
Vendor dashboards show token counts and API calls. Swarmix shows what the organisation is learning, where it is struggling, and what to do next.
| Capability | Vendor dashboards | Swarmix |
|---|---|---|
| Token usage and cost | Yes | Yes |
| Model comparison per task | No | Per-task, per-team |
| Interaction friction trends | Internal only | User-owned |
| Prompt quality tracking | No | Yes |
| Workflow pattern analysis | No | Flow visualisation + sequences |
| PII / governance monitoring | No | Per-category, per-region |
| Learning curve tracking | No | Per-team, over time |
| Data ownership | Vendor | Customer |
Strategic intelligence
Once AI activity is visible and governed, intelligence becomes possible
Today, intelligence is trapped across tools, vendors, and workflows. With Swarmix as a governed system of record, AI activity becomes a growing asset, compounding as usage accumulates across the organisation.
Decision Drift Detection
Decision HistoryDetect inconsistencies where similar decisions yield different outcomes due to prompt variations, model differences, or workflow drift across teams.
Enterprise Risk Memory
Enterprise MemoryRetain historical AI incidents, mitigation actions, and outcomes across the organisation. Improve future risk management with institutional memory.
Enterprise Decision Intelligence
Enterprise GovernanceAnalyse how AI influences decision-making across functions, business units, and leadership teams. Surface patterns invisible to any single tool.
Organisational Learning
Enterprise KnowledgeConvert AI usage, decisions, and governance activities into reusable institutional knowledge that compounds as the organisation grows.
System of record
The control layer becomes the authoritative record of AI activity
As AI adoption scales, the control layer accumulates enterprise-wide records that no individual tool, vendor, or application can create. Five dimensions form the foundation for organisational intelligence.
The compounding effect
Intelligence that gets more valuable every quarter
Month one delivers usage and cost data. Month three reveals adoption patterns and model preferences. Month six surfaces workflow bottlenecks and training gaps. Month twelve delivers predictive intelligence: churn prediction, anomaly detection, capacity planning.
Every AI interaction across every vendor and every team compounds into institutional knowledge. The longer Swarmix runs, the more valuable the intelligence becomes. And it belongs to the organisation, not the vendor.
One view across every vendor, model, and team.
Cost intelligence, adoption tracking, governance scoring, workforce effectiveness. Unified across the entire AI stack. Intelligence that compounds quarterly.
See how Swarmix works
A walkthrough of unified visibility, governance, and intelligence across every AI vendor and team.
- Deploy in weeks
- Works with any existing AI stack
- The road to 42001, GDPR ready