EnterpriseOverviewIntelligenceWho It's ForSecurityIT Governance
Pricing
ResourcesBlogFAQ
Get in touch
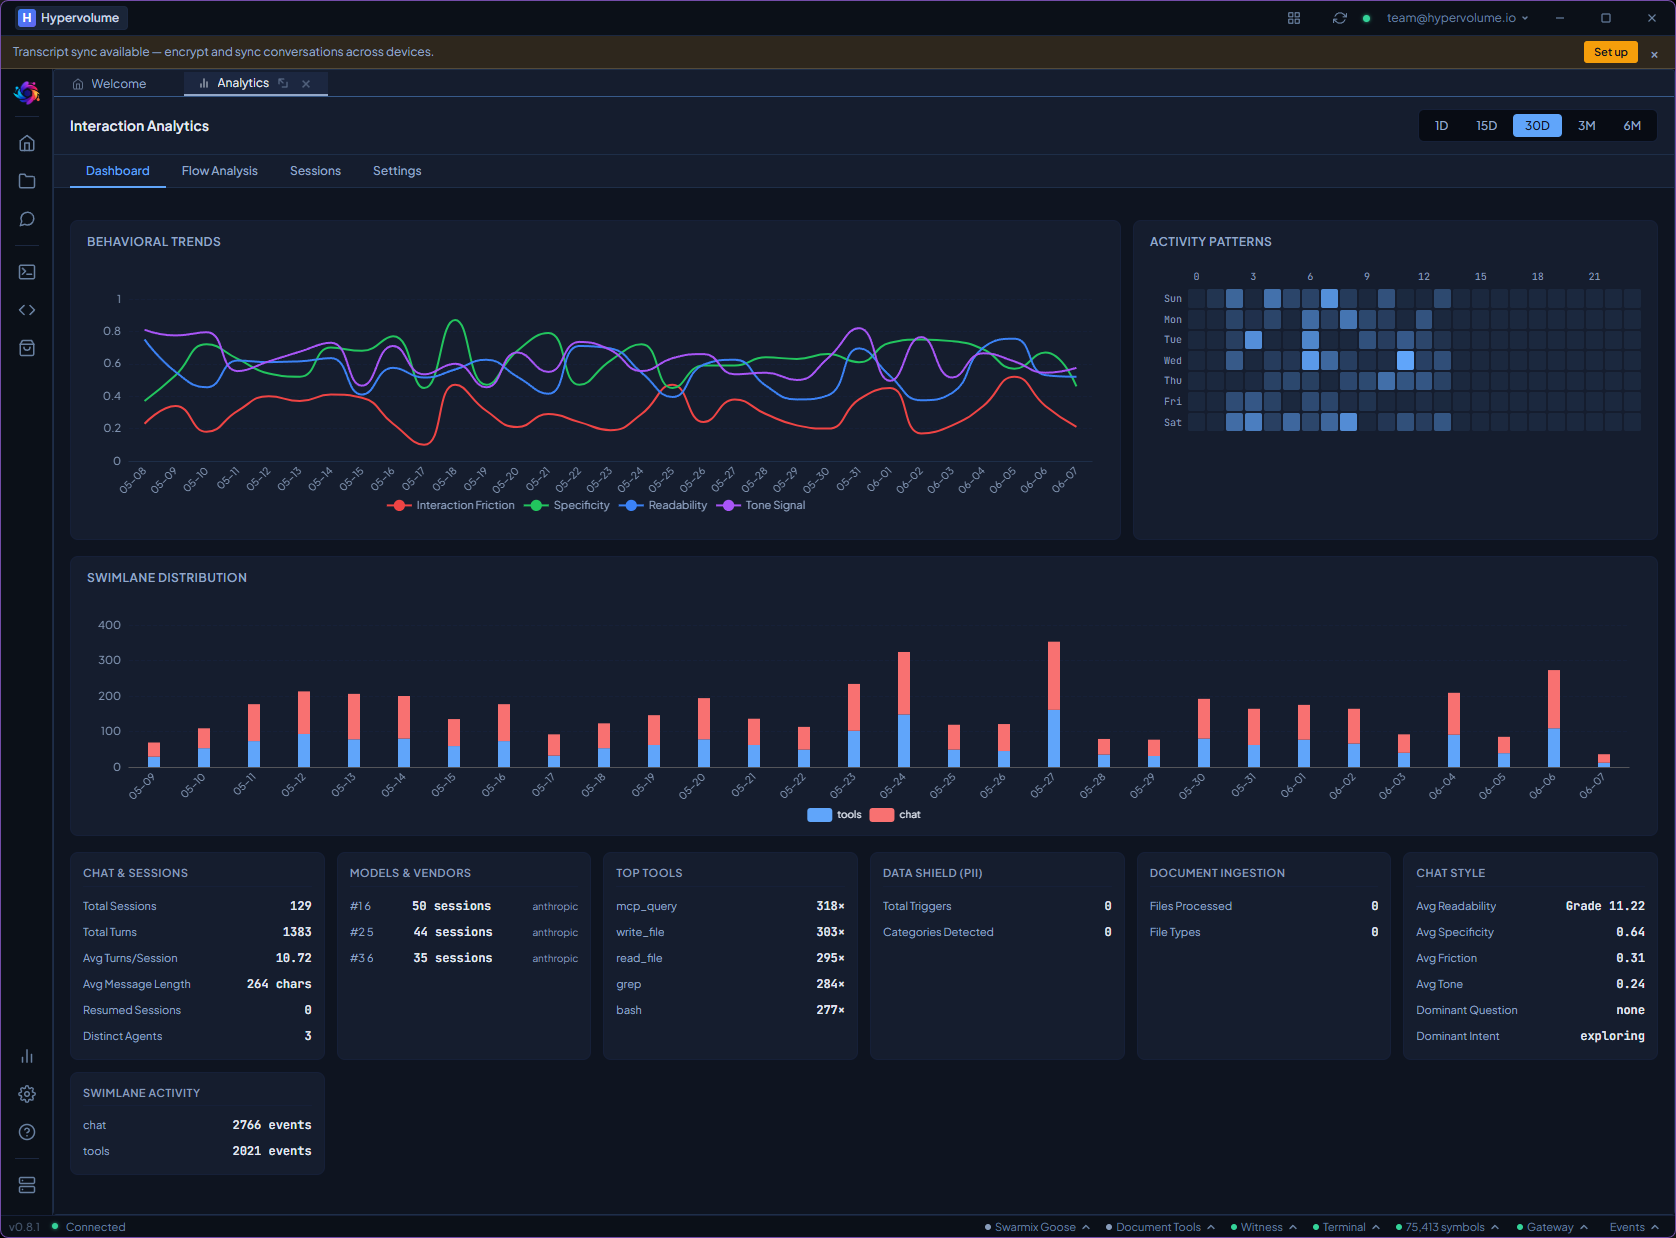
Interaction Analytics
AI interaction data is a strategic asset. Own it.
Each vendor only sees their own slice. Swarmix sits across all of them, capturing the full picture of how an organisation uses AI across every vendor, every model, and every team.
Preview
A glimpse of what's coming
Early designs. The final product may look different, but the intelligence it delivers won't.
The blind spot
Each vendor sees only their own slice. Nobody sees the whole picture.
The Anthropic console shows Claude usage. OpenAI shows GPT usage. Google shows Gemini. Three dashboards, three partial views, zero cross-vendor intelligence. Total spend across all of them? Which model works best for which task? Whether AI is actually making people more productive? Unanswerable.
Swarmix sits at the coordination layer, above the model layer. It captures interaction data across every vendor, every model, and every team. One unified view of how an entire organisation uses AI.
Six pillars of business value
From raw usage data to strategic intelligence
Each pillar answers a question the board asks, with a metric they can track quarterly.
Cost Intelligence & ROI
Cost per session, per turn, per model, aggregated by team, department, region. Cost to complete a task, not cost per token. Model switching patterns reveal wasted spend.
- Budget allocation with department chargeback
- Model standardisation: route simple tasks to efficient models
- ROI quantification against developer time
Adoption & Engagement
Sessions per user, activity heatmaps, feature utilisation, resumption rates. See who's productive, who's struggling, and who hasn't started.
- Identify low-adoption teams before renewal
- Reallocate unused seats, right-size contracts
- Promote underused capabilities with data
Governance & Compliance
PII triggers by category and department, approval friction, regional exposure patterns. Automated evidence for auditors and regulators.
- Compliance reporting with automated audit evidence
- Regional policy customisation with stricter controls where needed
- Department-level AI risk dashboards for the CISO
Workforce Effectiveness
Interaction friction trends, prompt quality, turns-to-resolution, session completion. Measuring whether AI is making people better, not just faster.
- Training ROI: workshop reduced friction by 40% in 2 weeks
- AI fluency benchmarking across teams and departments
- New employee time-to-AI-proficiency (measurable)
AI Strategy & Model Optimisation
Model performance by task type and team, vendor concentration risk, workflow pattern analysis. Data-driven model selection instead of gut feeling.
- Model recommendation policies per task type
- Multi-vendor strategy with diversification data
- Workflow templating from observed best practices
Predictive Intelligence
With accumulated data: churn prediction, proactive model routing, anomaly detection, capacity planning. The analytics mature as the data grows.
- Friction spike predicts tool abandonment 2 weeks early
- Usage growth trends predict infrastructure needs
- Anomaly alerts for sudden PII spikes or approval bypass
The aggregation pyramid
Privacy-first intelligence. From individual to company-wide.
Data flows upward from private (individual) to strategic (company), with privacy enforcement at every level. Content never leaves the device. Only structural metrics aggregate.
How it's different
Vendors keep the intelligence. Swarmix returns it.
| Capability | Vendor dashboards | Swarmix |
|---|---|---|
| Token usage & cost | Yes | Yes |
| Model comparison per task | No | Per-task, per-team |
| Interaction friction trends | Internal only | User-owned |
| Prompt quality tracking | No | Yes |
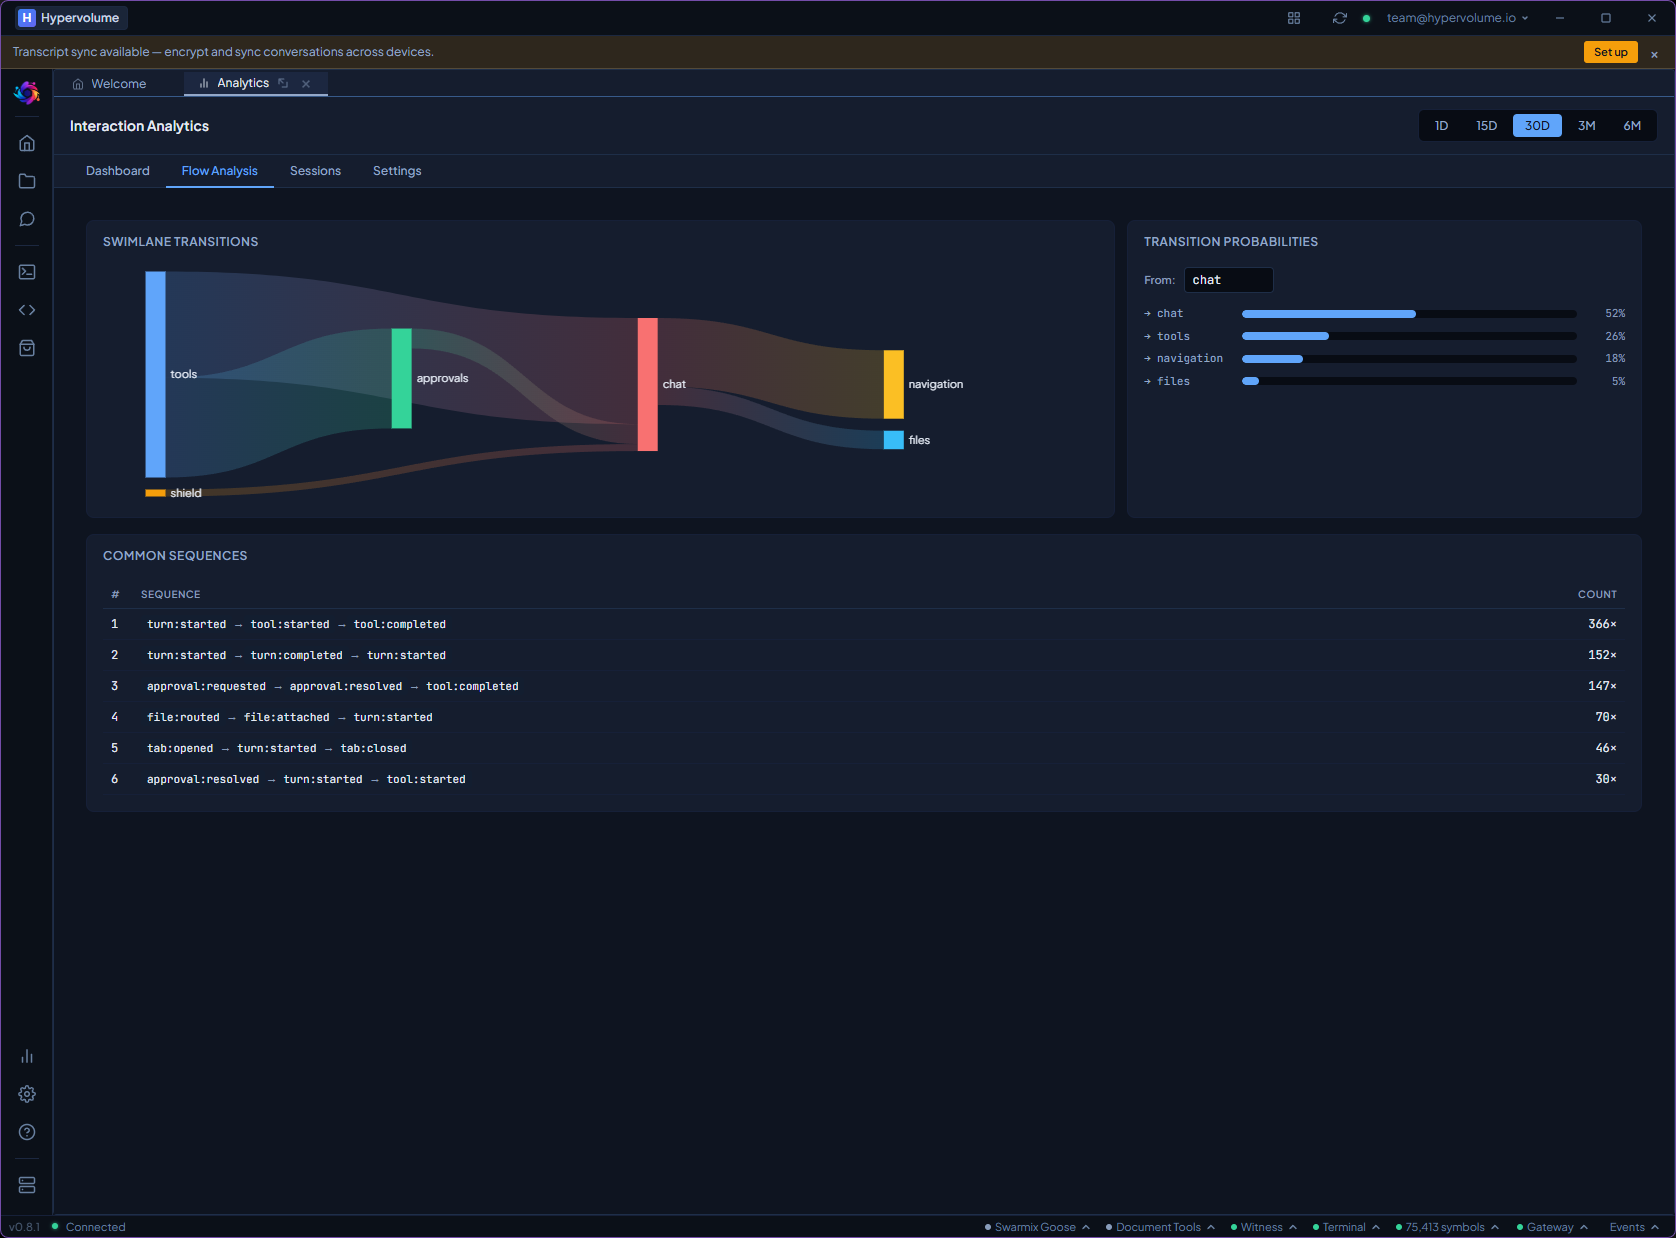
| Workflow pattern analysis | No | Sankey + sequences |
| PII / governance monitoring | No | Per-category, per-region |
| Learning curve tracking | No | Per-team, over time |
| Data ownership | Vendor | Customer |
One view across every vendor, model, and team.
Cost intelligence, adoption tracking, governance scoring, workforce effectiveness, unified across the entire AI stack.
See how Swarmix works
A walkthrough of unified visibility, governance, and intelligence across every AI vendor and team.
- Deploy in weeks
- Works with any existing AI stack
- SOC 2 compliant, GDPR ready